Spiral Plot
Reach for it when you suspect a long sequence repeats on a fixed cycle, because winding it so every period lands on the same ray puts like phases together.
It is an object, not a picture
The chart remembers the table it was built from. Add a column or delete a series and it regenerates every bar, axis, label and legend in one step, which is also one press of undo. Nothing is baked until you decide it should be: ungroup it and the markers become ordinary paths and text you can restyle, recolour and pull apart like any other artwork.
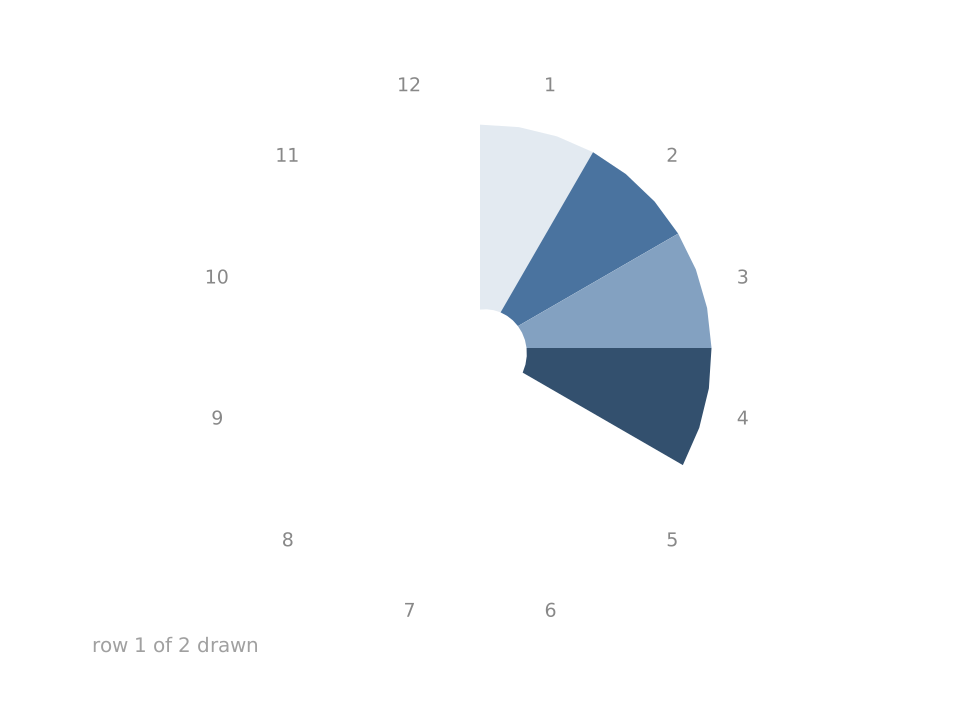
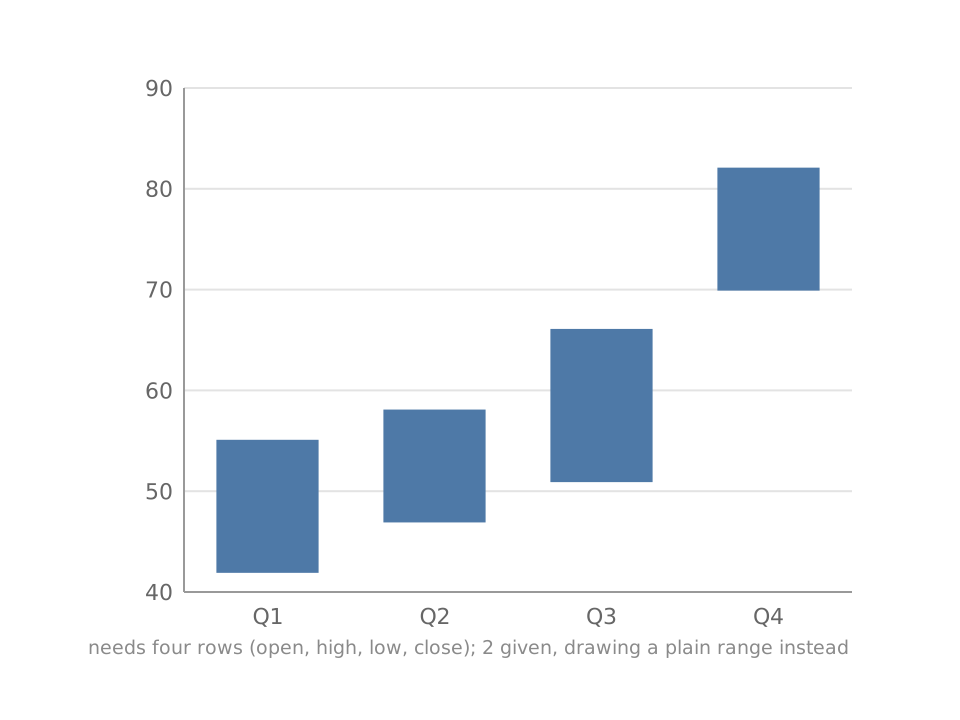
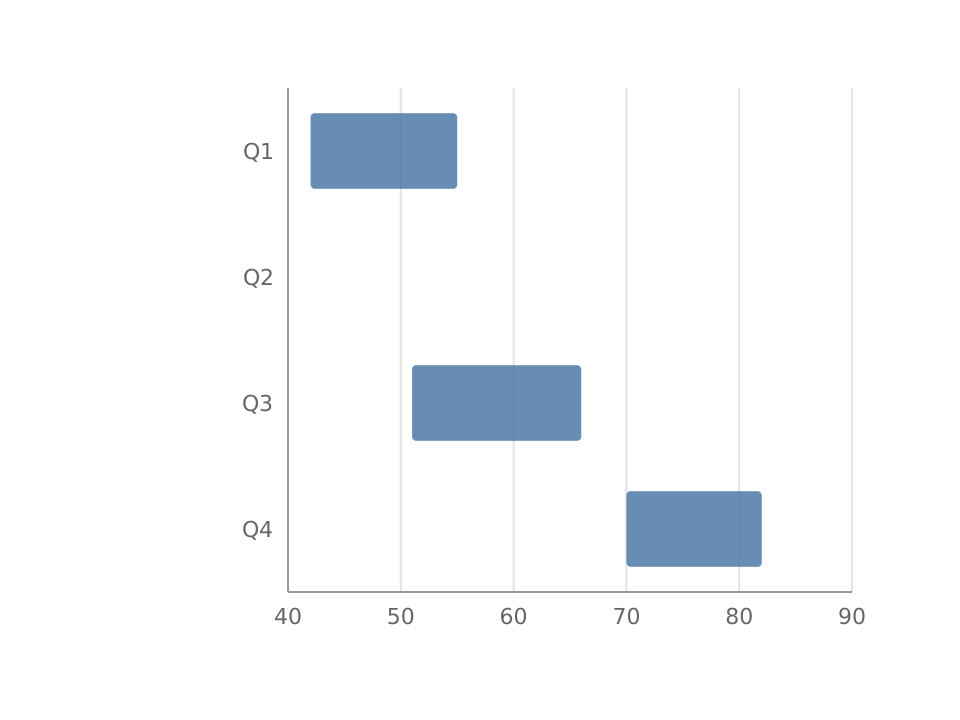
These are sample numbers. Type over them and the chart redraws as you go, with no sign in and nothing to install.
SVG and PNG are included free, five downloads a day shared with the editor. PDF and the 2x, 3x and 4x sizes are Pro, and live in the editor.