
Change over time charts
12 change over time charts. A value moving. Trends, cumulative totals, rankings that swap places, and the shapes that show a sequence rather than a snapshot.
All charts
Basics
Magnitude
Change over time
Distribution
Part to whole
Relationship
Flow & hierarchy
Spatial
Nothing matches that.
Every Change over time chart
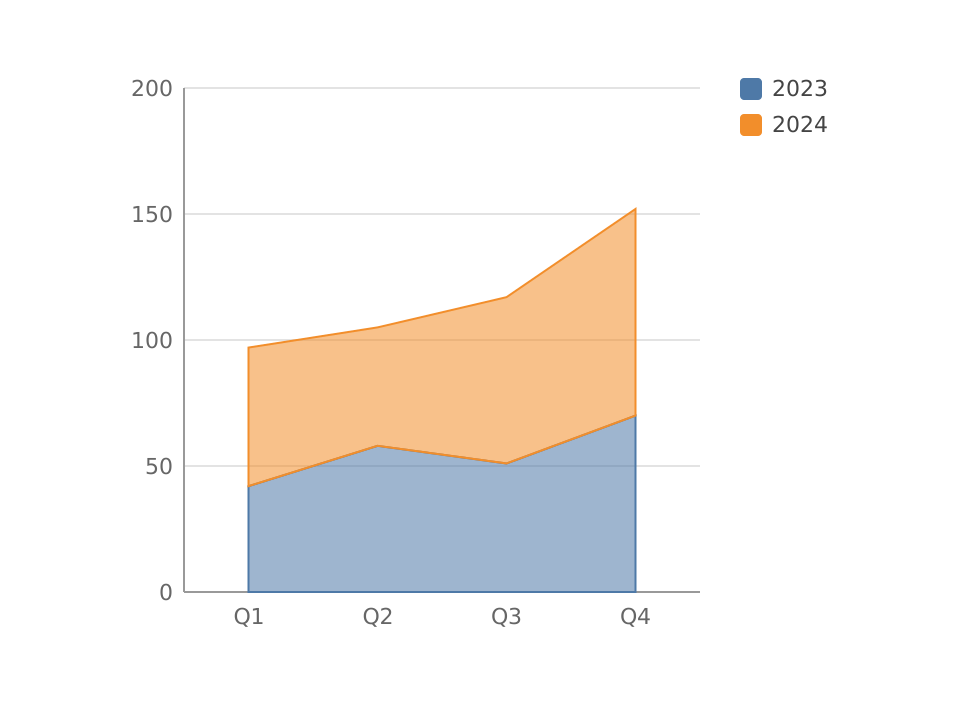
Stacked AreaChange over time
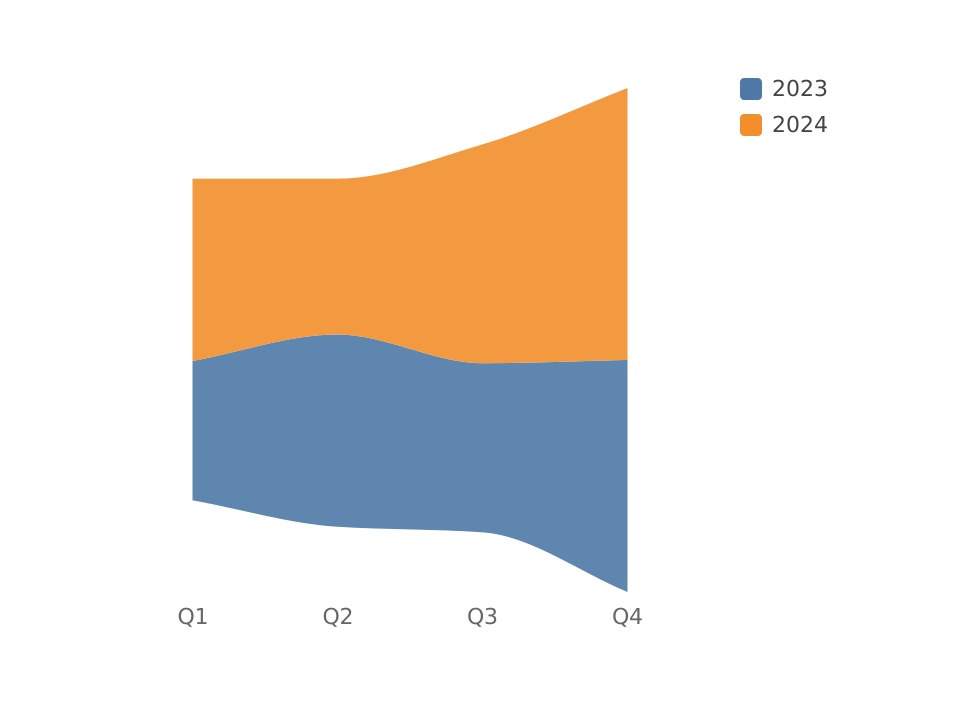
Streamgraph (ThemeRiver)Change over time
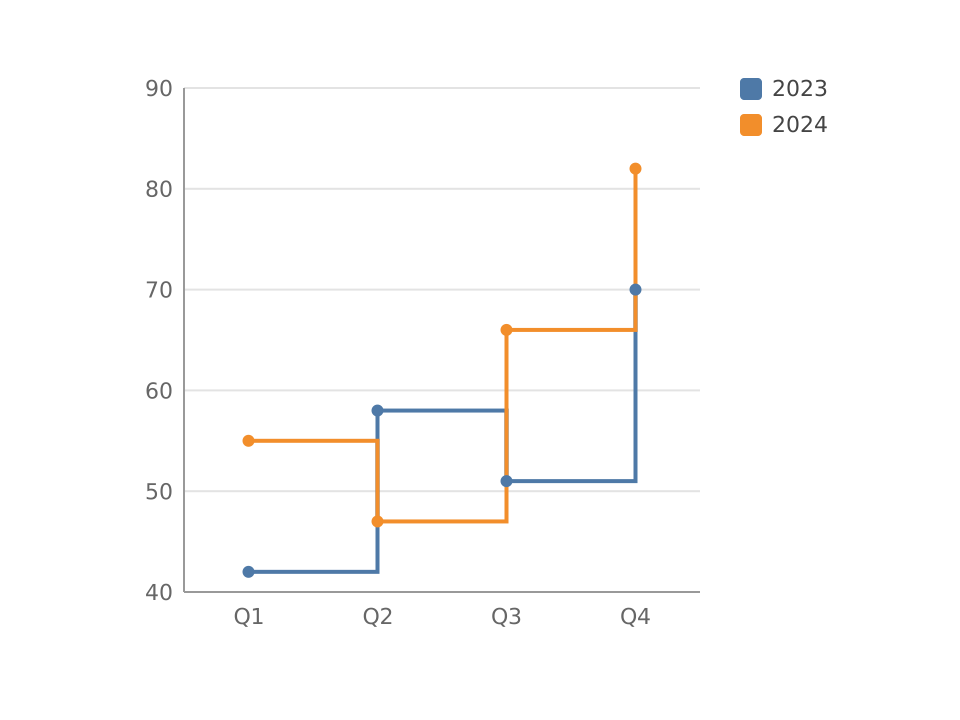
Step LineChange over time
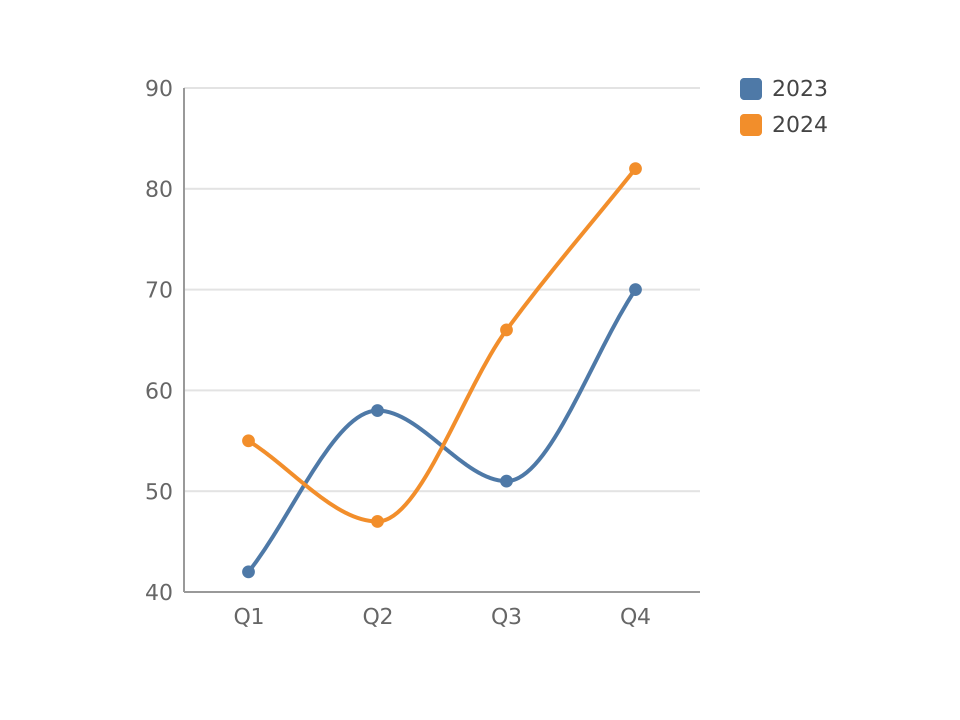
Smooth Line (Spline)Change over time
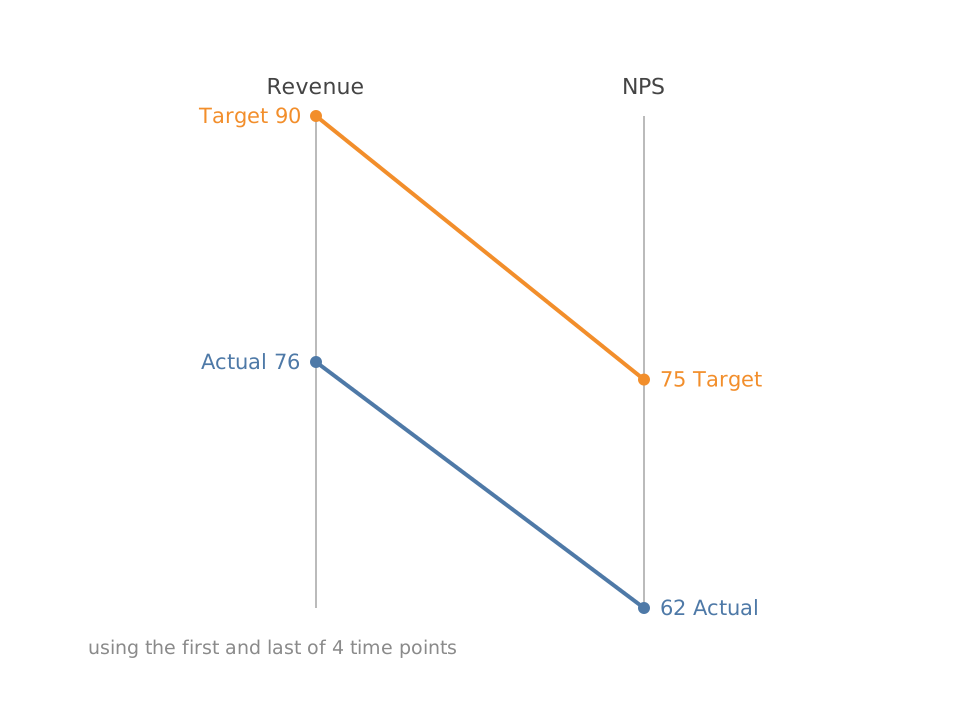
Slope GraphChange over time
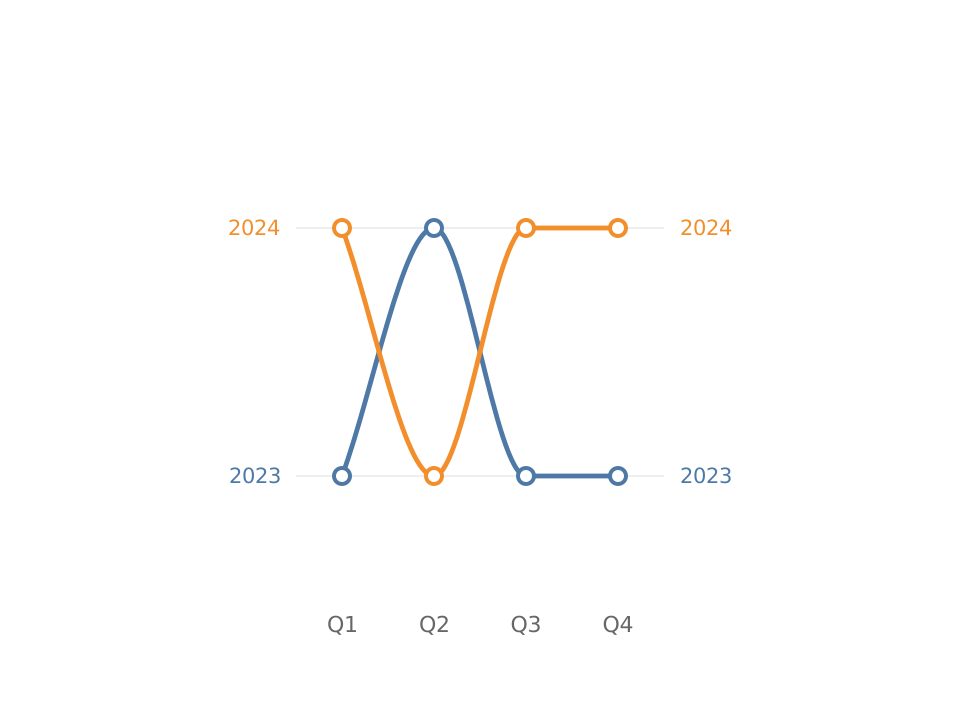
Bump Chart (Rank over Time)Change over time
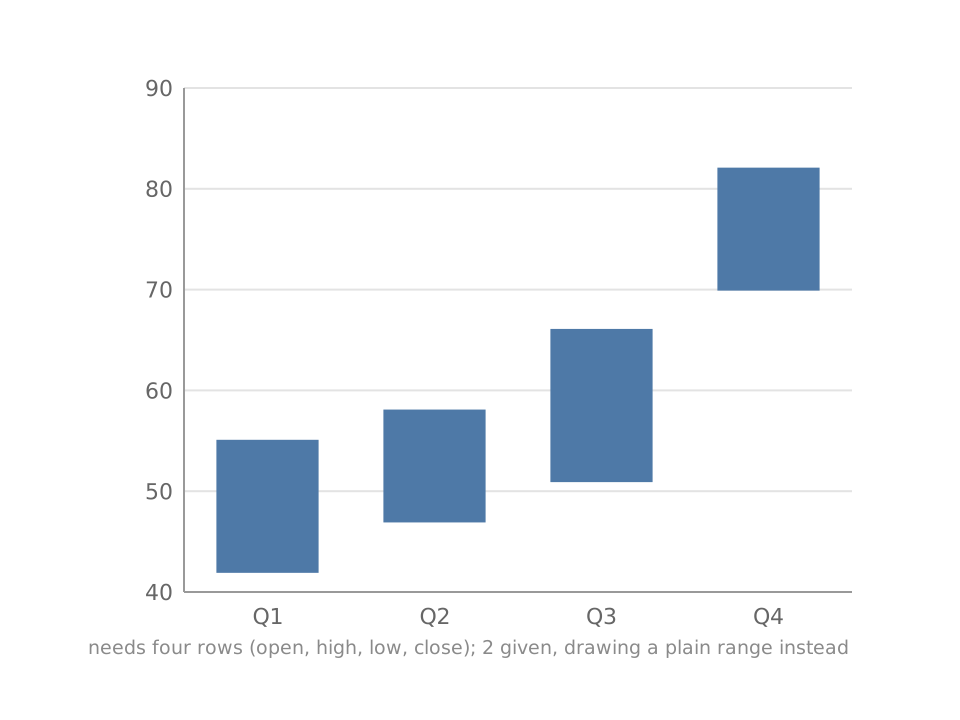
Candlestick / OHLCChange over time
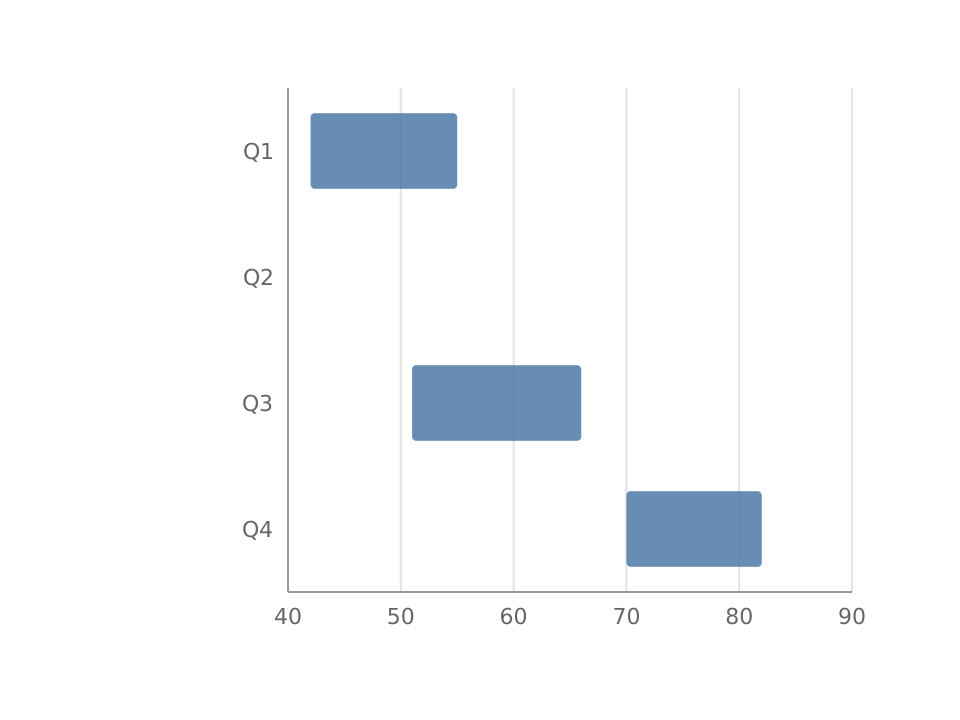
Gantt / TimelineChange over time
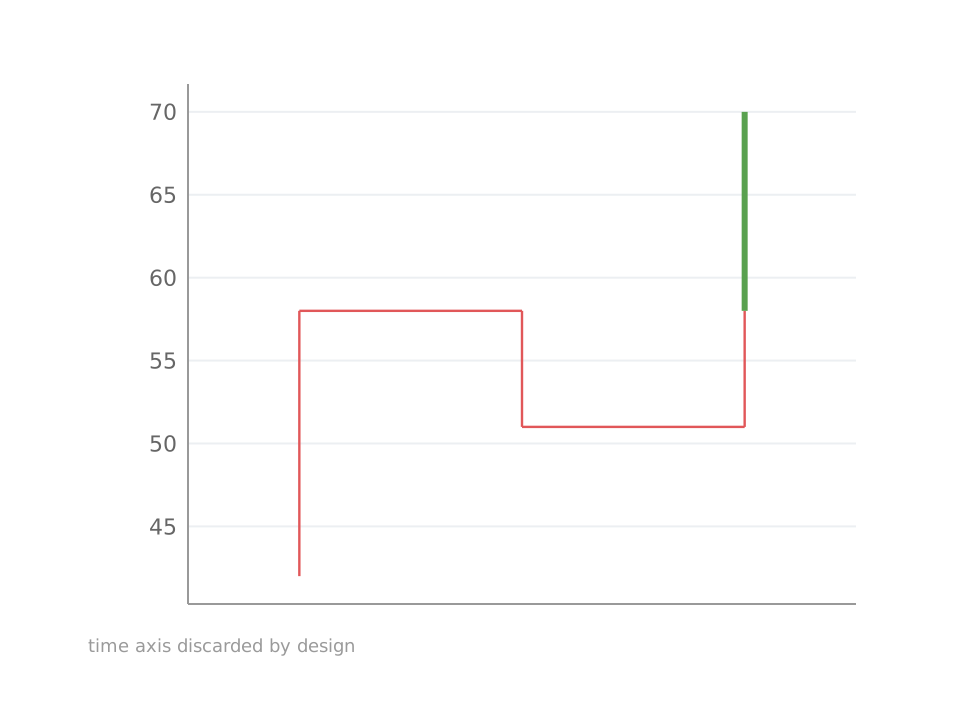
KagiChange over time
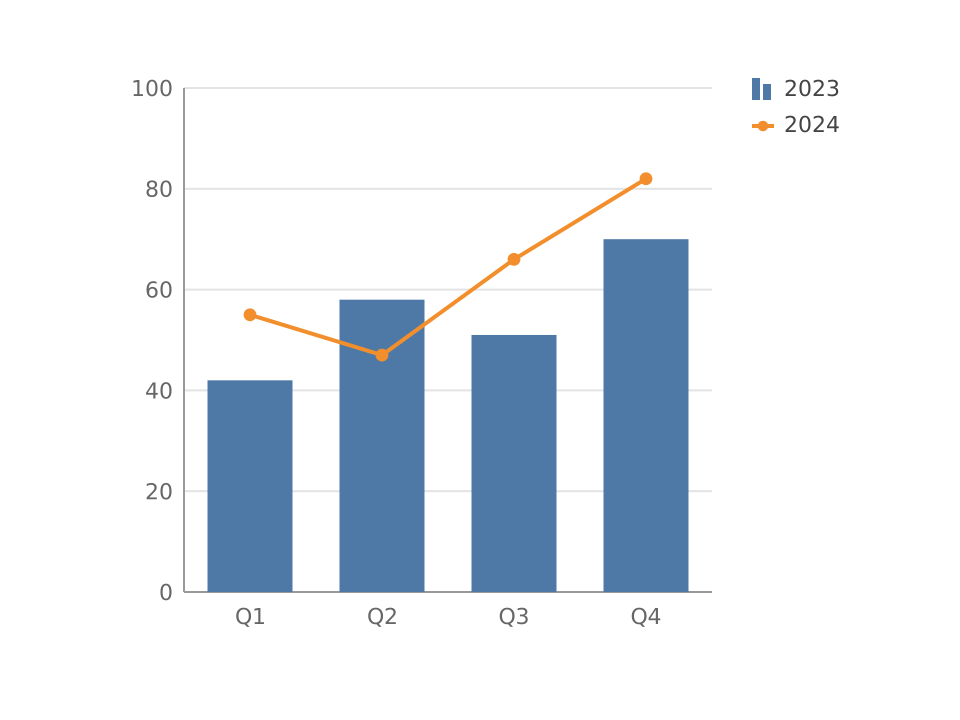
ComboChange over time
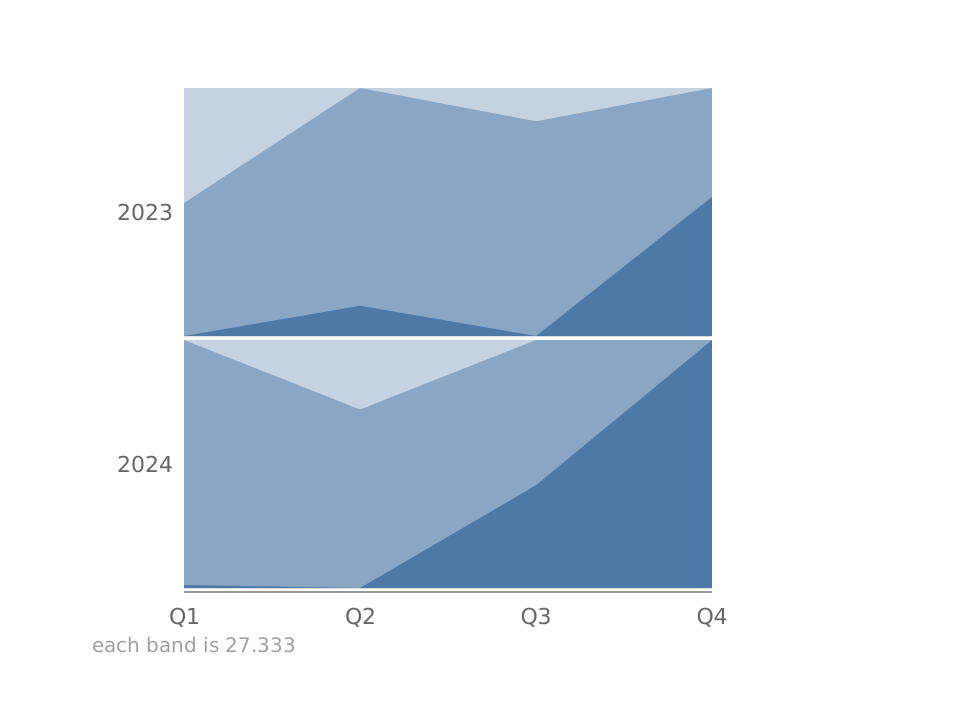
Horizon ChartChange over time
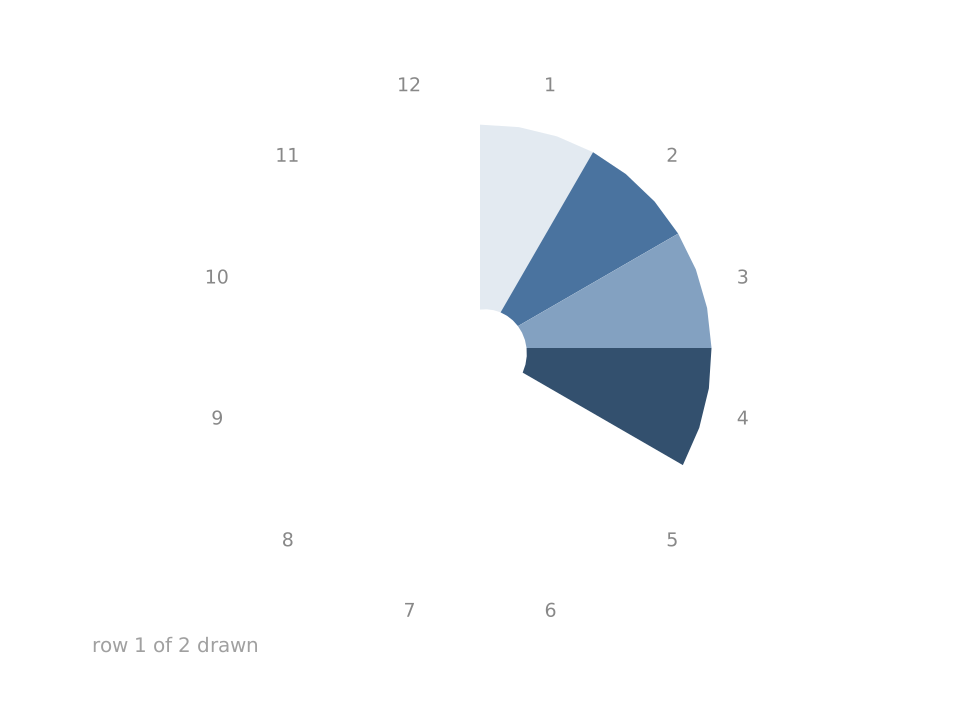
Spiral PlotChange over time