
Distribution charts
11 distribution charts. Where the values actually sit. Not the average, but the spread, the shape, the tails and the outliers the average hides.
All charts
Basics
Magnitude
Change over time
Distribution
Part to whole
Relationship
Flow & hierarchy
Spatial
Nothing matches that.
Every Distribution chart
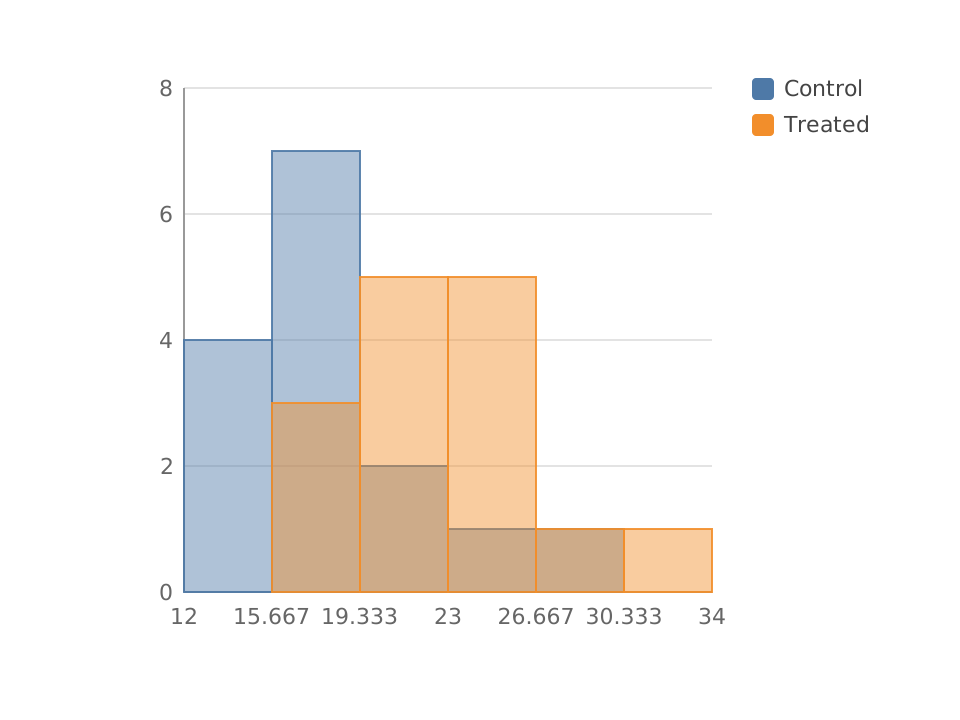
HistogramDistribution
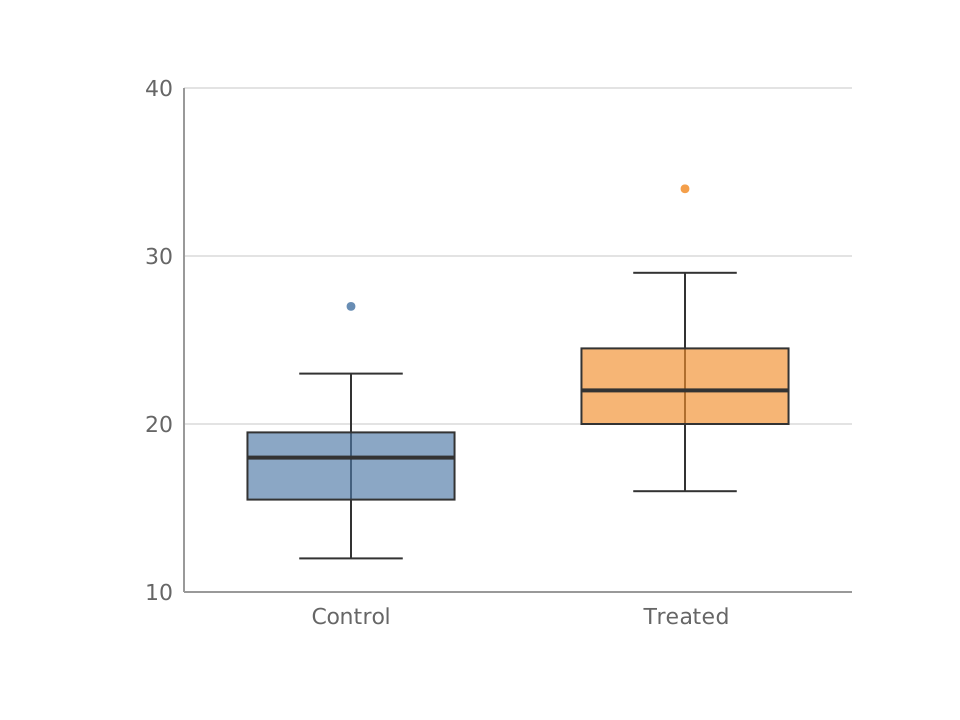
Box and WhiskerDistribution
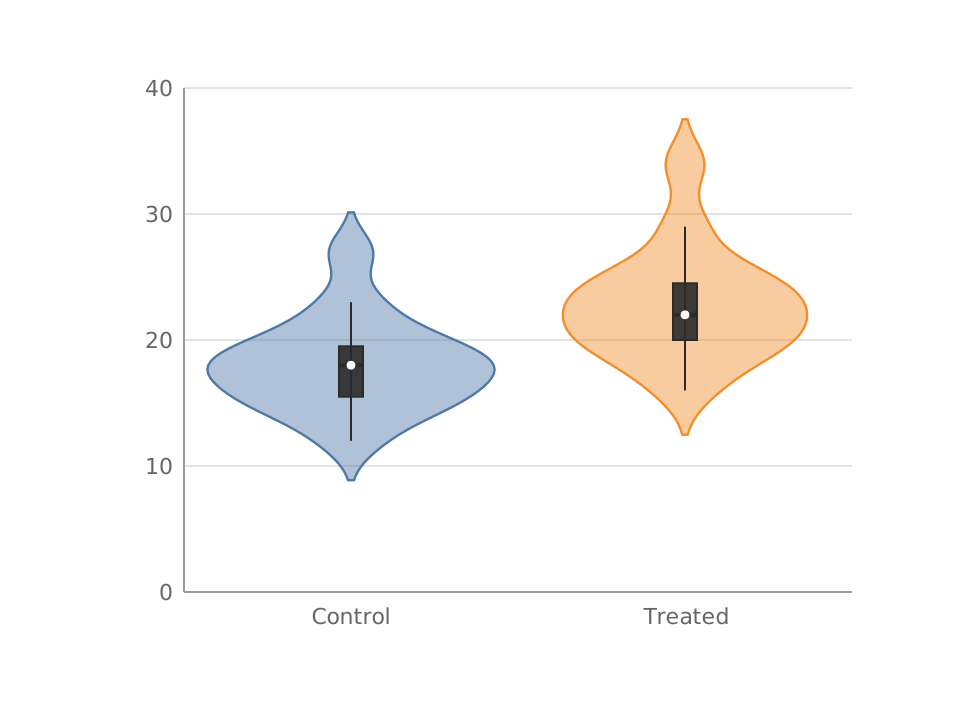
Violin PlotDistribution
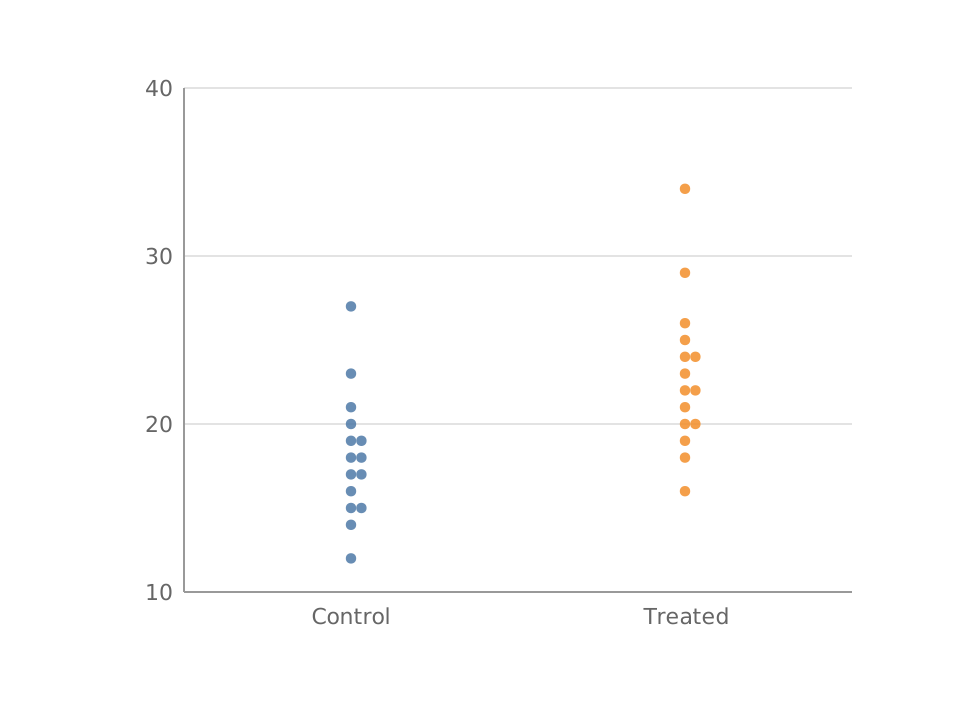
Beeswarm / Strip PlotDistribution
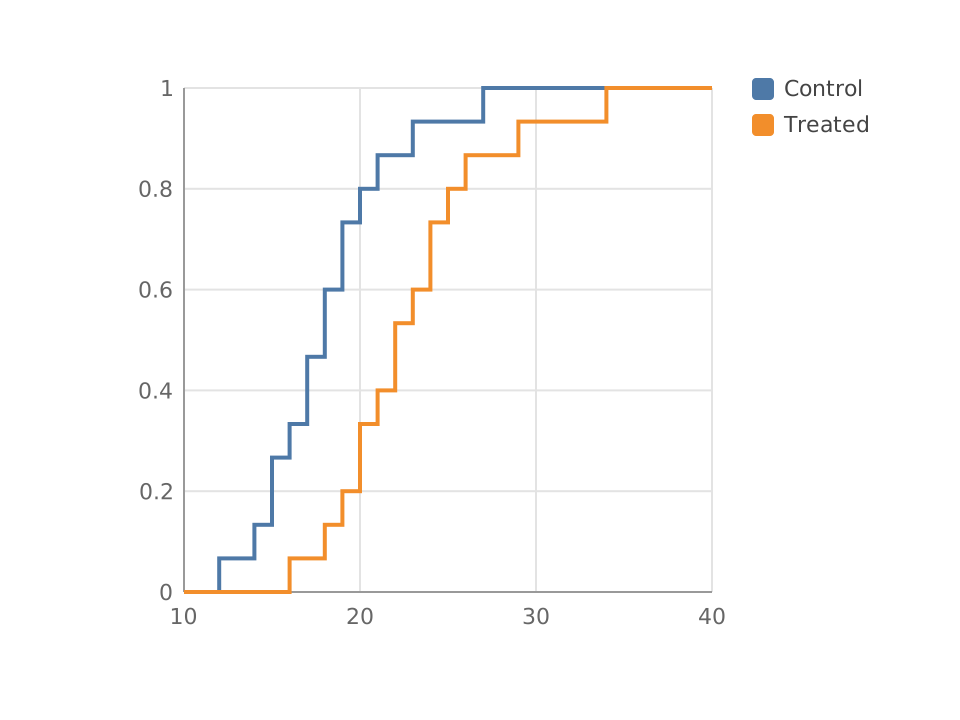
Empirical CDF / OgiveDistribution
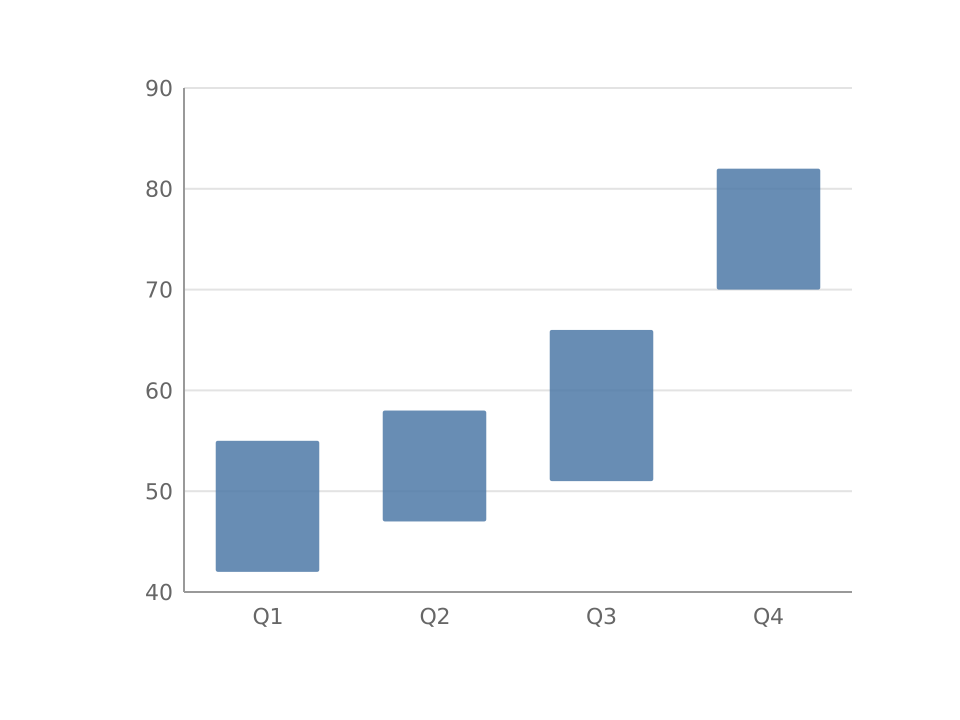
Range Bar (Floating)Distribution
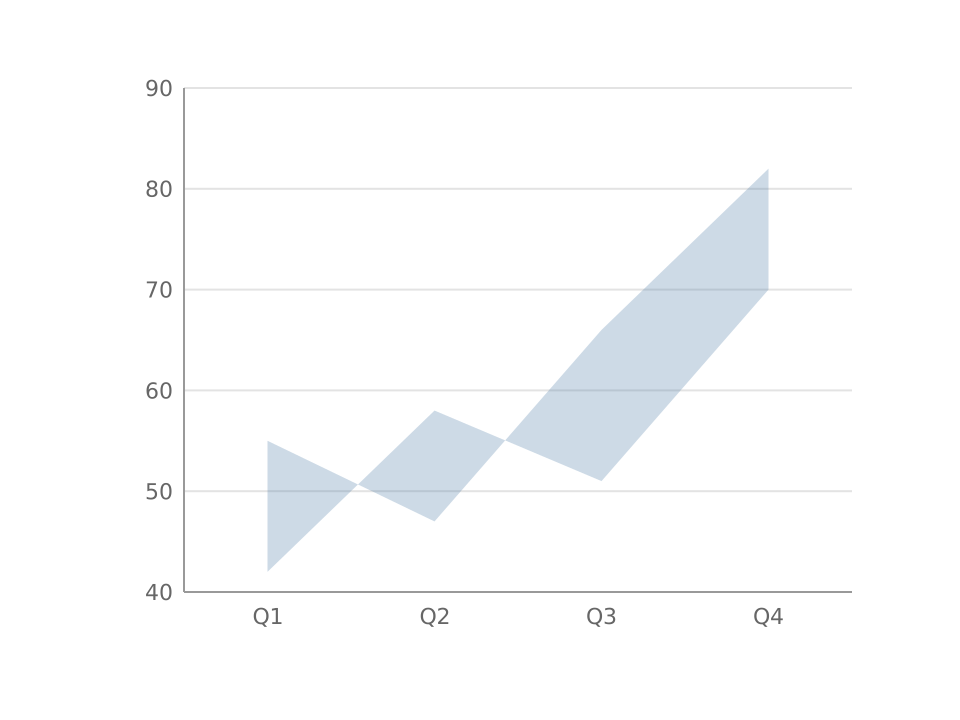
Range Area / Confidence BandDistribution
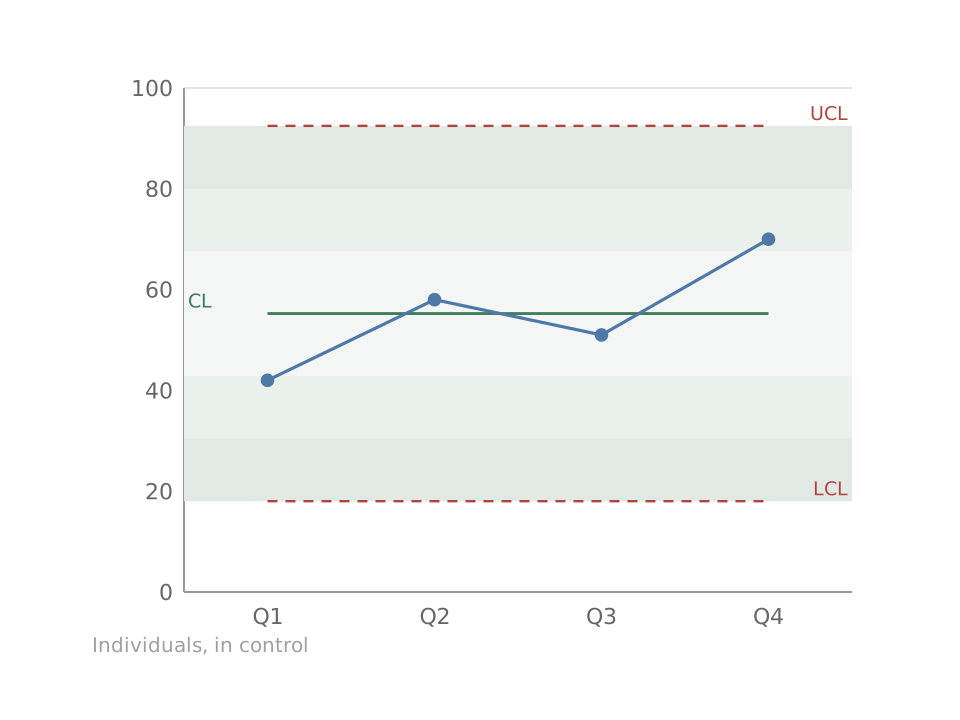
Control ChartDistribution
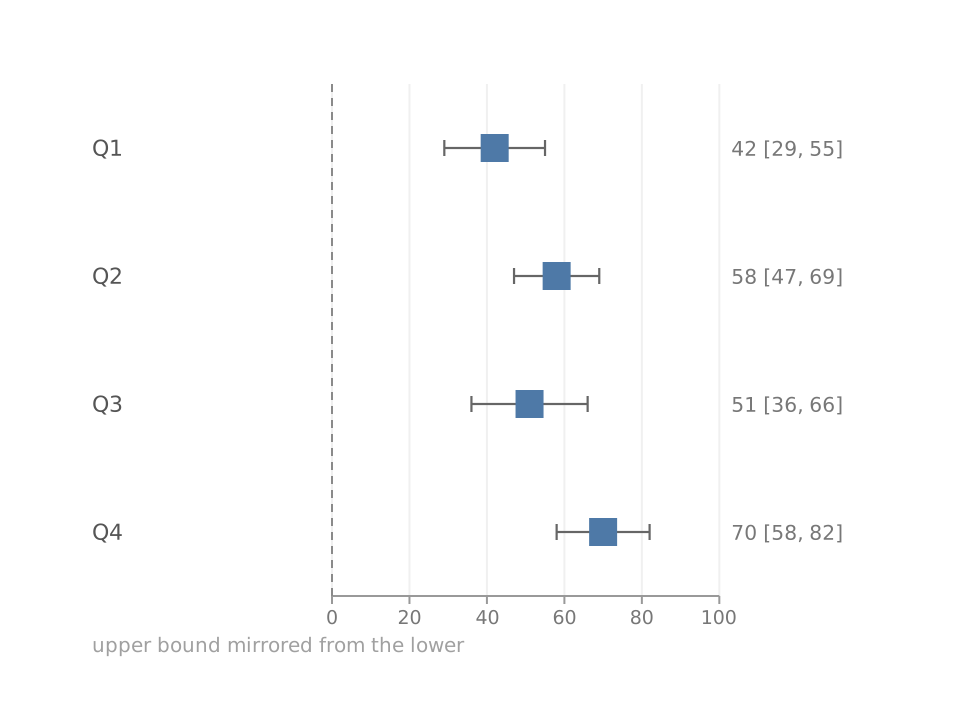
Forest PlotDistribution
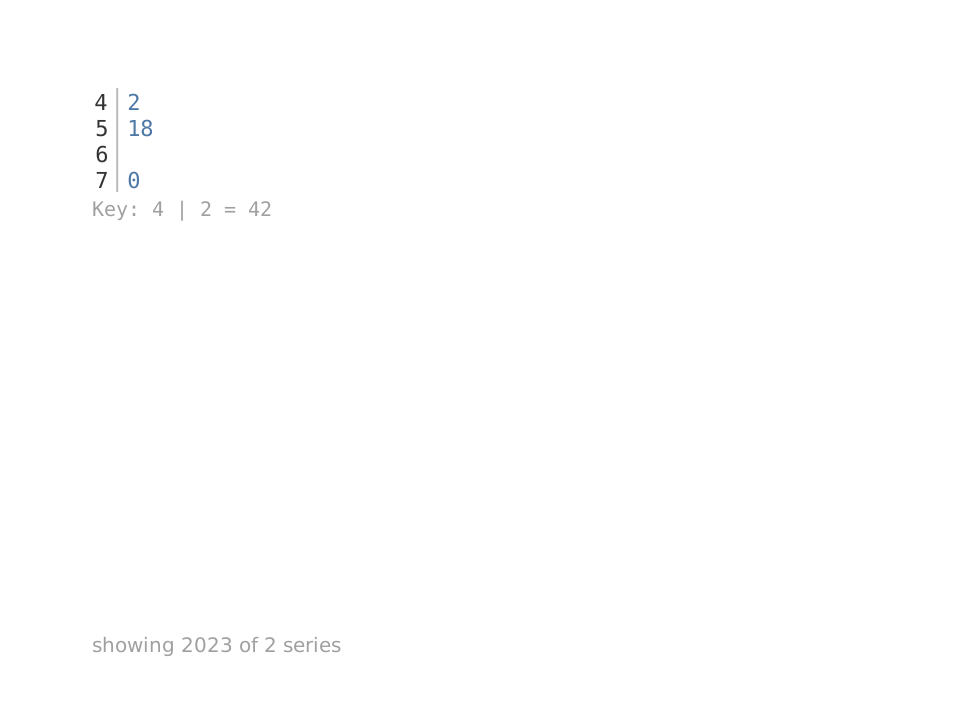
Stem and Leaf PlotDistribution
Survival CurveDistribution